pandas.Series.plot.box#
- Series.plot.box(by=None, **kwargs)[源代码]#
绘制 DataFrame 列的箱线图。
箱线图是一种通过四分位数来图形化描述数值数据组的方法。箱体从数据的 Q1 到 Q3 四分位值延伸,中间有一条线表示中位数 (Q2)。须线从箱体的边缘延伸以显示数据的范围。须线的默认位置设置为距离箱体边缘 1.5*IQR (IQR = Q3 - Q1)。异常值点是超出须线末尾的点。
有关更多详细信息,请参阅 Wikipedia 的 boxplot 条目。
使用此图表时需要注意的一点是,箱体和须线可能会重叠,这在绘制少量数据时非常常见。
- Parameters:
- bystr or sequence
用于分组的 DataFrame 中的列。
在 1.4.0 版本发生变更: 以前,by 被默默忽略,并且不进行任何分组
- **kwargs
其他关键字在
DataFrame.plot()中有文档记录。
- Returns:
matplotlib.axes.Axes或它们的 numpy.ndarray。
参见
DataFrame.boxplot绘制箱线图的另一种方法。
Series.plot.box从 Series 对象绘制箱线图。
matplotlib.pyplot.boxplot在 matplotlib 中绘制箱线图。
Examples
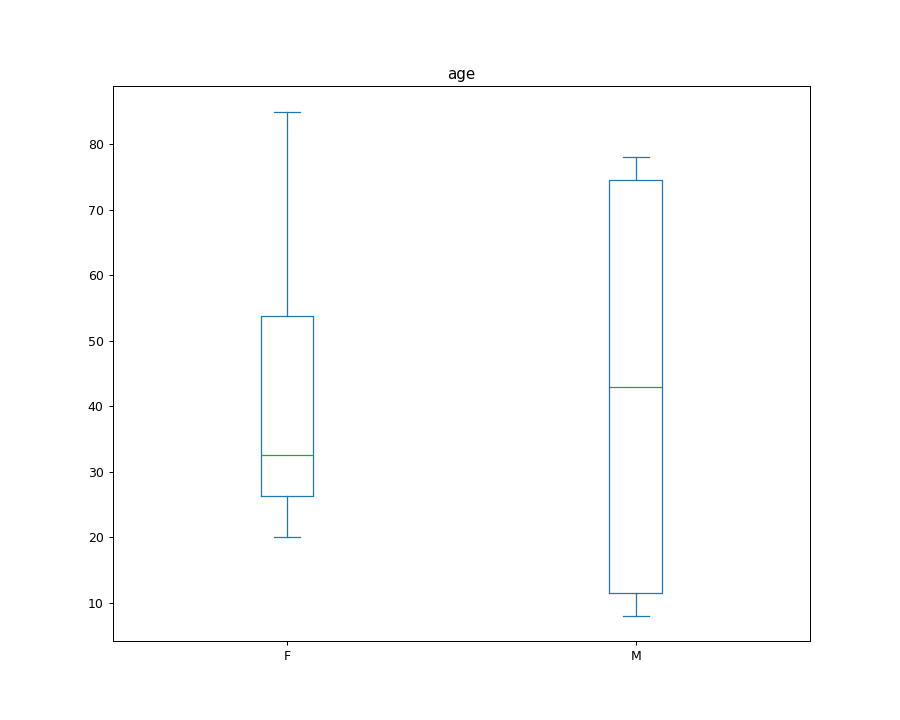
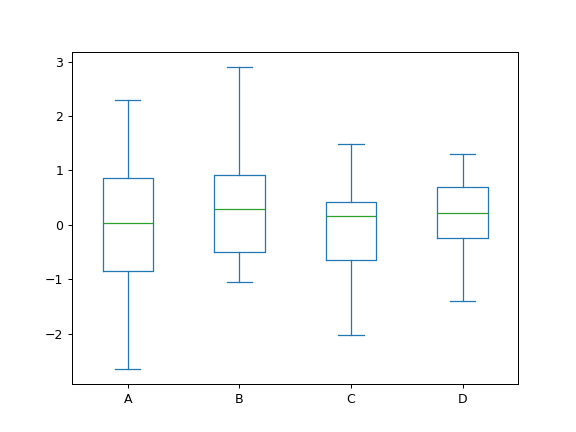
从四个包含随机生成数据的列的 DataFrame 中绘制箱线图。
>>> data = np.random.randn(25, 4)
>>> df = pd.DataFrame(data, columns=list('ABCD'))
>>> ax = df.plot.box()
如果指定 by 参数(它可以接受列名,或列名的列表或元组),您还可以生成分组:
在 1.4.0 版本发生变更.
>>> age_list = [8, 10, 12, 14, 72, 74, 76, 78, 20, 25, 30, 35, 60, 85]
>>> df = pd.DataFrame({"gender": list("MMMMMMMMFFFFFF"), "age": age_list})
>>> ax = df.plot.box(column="age", by="gender", figsize=(10, 8))