pandas.Series.plot.area#
- Series.plot.area(x=None, y=None, stacked=True, **kwargs)[源代码]#
绘制堆叠面积图。
面积图以可视化的方式显示定量数据。此函数封装了 matplotlib 的 area 函数。
- Parameters:
- x标签或位置,可选。
X 轴的坐标。默认使用索引。
- y标签或位置,可选。
要绘制的列。默认使用所有列。
- stackedbool, default True
默认情况下,面积图是堆叠的。设置为 False 以创建非堆叠图。
- **kwargs
附加关键字参数在
DataFrame.plot()中有详细说明。
- Returns:
- matplotlib.axes.Axes 或 numpy.ndarray。
面积图,或如果 subplots 为 True,则为面积图数组。
参见
DataFrame.plot使用 matplotlib / pylab 绘制 DataFrame 图。
Examples
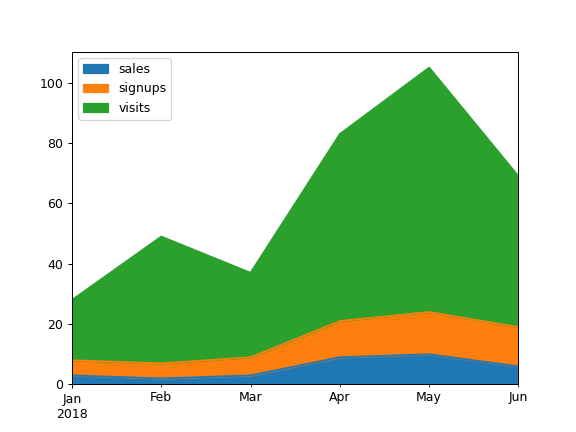
根据基本业务指标绘制面积图:
>>> df = pd.DataFrame({
...     'sales': [3, 2, 3, 9, 10, 6],
...     'signups': [5, 5, 6, 12, 14, 13],
...     'visits': [20, 42, 28, 62, 81, 50],
... }, index=pd.date_range(start='2018/01/01', end='2018/07/01',
...                        freq='ME'))
>>> ax = df.plot.area()
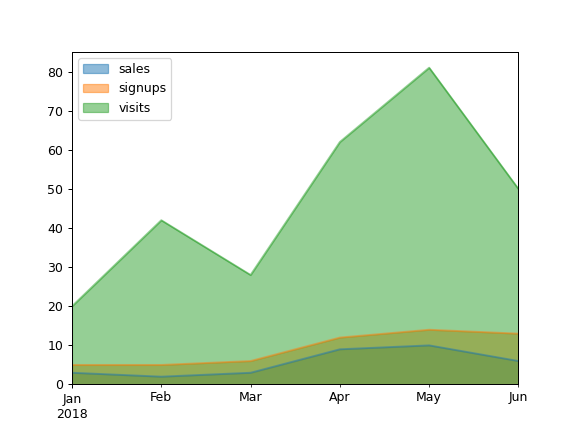
默认情况下,面积图是堆叠的。要生成非堆叠图,请传递
stacked=False:>>> ax = df.plot.area(stacked=False)
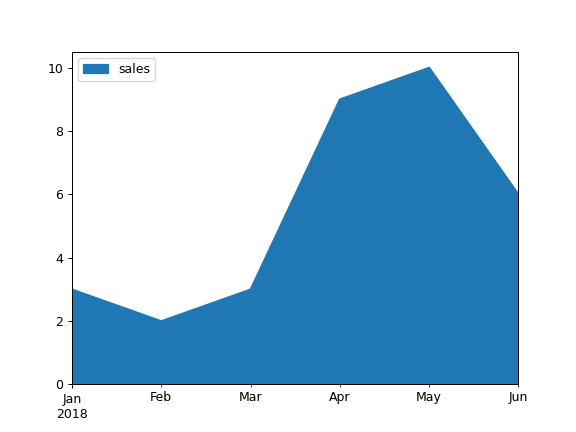
绘制单个列的面积图:
>>> ax = df.plot.area(y='sales')
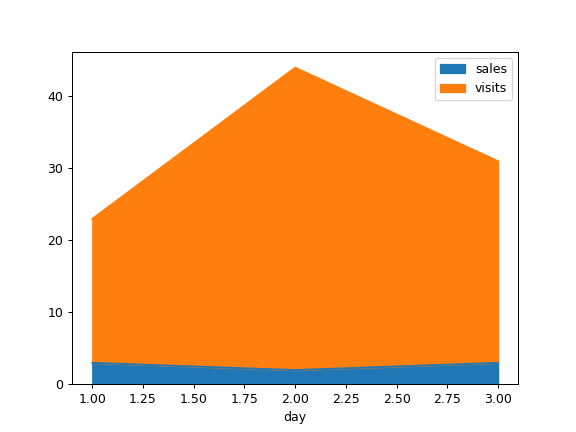
使用不同的 x 绘制:
>>> df = pd.DataFrame({
...     'sales': [3, 2, 3],
...     'visits': [20, 42, 28],
...     'day': [1, 2, 3],
... })
>>> ax = df.plot.area(x='day')