pandas.DataFrame.plot.hexbin#
- DataFrame.plot.hexbin(x, y, C=None, reduce_C_function=None, gridsize=None, **kwargs)[源代码]#
生成六边形分箱图。
生成 x 与 y 的六边形分箱图。如果 C 为 None (默认),则这是在
(x[i], y[i])处的观测次数的直方图。如果指定了 C,则指定在给定坐标
(x[i], y[i])处的值。这些值根据 reduce_C_function`(默认为 NumPy 的均值函数,见 :meth:`numpy.mean )累加到每个六边形箱中,然后进行归约。(如果指定了 C,它也必须是与 x 和 y 长度相同的 1-D 序列,或者是一个列标签。)- Parameters:
- xint 或 str
x 点的列标签或位置。
- yint 或 str
y 点的列标签或位置。
- Cint 或 str,可选
(x, y) 点值的列标签或位置。
- reduce_C_function : callable,默认 np.meancallable, 默认
将箱中的所有值归约到单个数字的(例如 np.mean、np.max、np.sum、np.std)的单参数函数。
- gridsizeint 或 (int, int) 的元组,默认 100
x 方向上的六边形数量。y 方向上的相应六边形数量的选择方式使得六边形大致呈规则形状。或者,gridsize 可以是一个包含两个元素的元组,分别指定 x 方向和 y 方向上的六边形数量。
- **kwargs
附加关键字参数在
DataFrame.plot()中有详细说明。
- Returns:
- matplotlib.AxesSubplot
绘制 hexbin 的 matplotlib
Axes。
参见
DataFrame.plot绘制 DataFrame 的图形。
matplotlib.pyplot.hexbin使用 matplotlib 的六边形分箱图,matplotlib 是底层使用的函数。
Examples
以下示例使用来自正态分布的随机数据生成。
>>> n = 10000
>>> df = pd.DataFrame({'x': np.random.randn(n),
...                    'y': np.random.randn(n)})
>>> ax = df.plot.hexbin(x='x', y='y', gridsize=20)

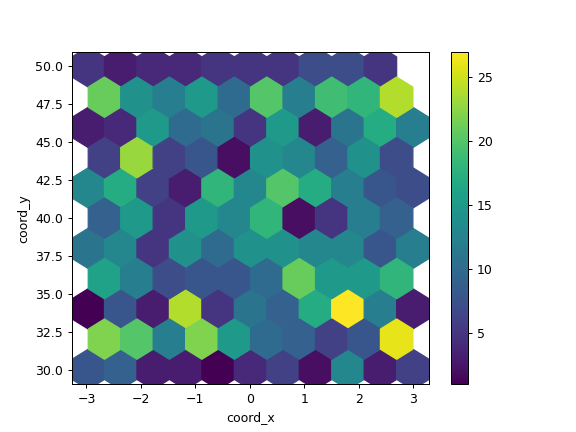
下一个示例使用 C 和 np.sum 作为 reduce_C_function。请注意,’observations’ 的值范围从 1 到 5,但结果图显示的值超过 25。这是因为 reduce_C_function。
>>> n = 500
>>> df = pd.DataFrame({
...     'coord_x': np.random.uniform(-3, 3, size=n),
...     'coord_y': np.random.uniform(30, 50, size=n),
...     'observations': np.random.randint(1,5, size=n)
...     })
>>> ax = df.plot.hexbin(x='coord_x',
...                     y='coord_y',
...                     C='observations',
...                     reduce_C_function=np.sum,
...                     gridsize=10,
...                     cmap="viridis")