pandas.plotting.lag_plot#
- pandas.plotting.lag_plot(series, lag=1, ax=None, **kwds)[源代码]#
时间序列的滞后图。
- Parameters:
- seriesSeries
要可视化的时间序列。
- lagint, 默认值 1
散点图的滞后长度。
- axMatplotlib 轴对象, 可选
要使用的 matplotlib 轴对象。
- **kwds
Matplotlib 散点图方法关键字参数。
- Returns:
- matplotlib.axes.Axes
Examples
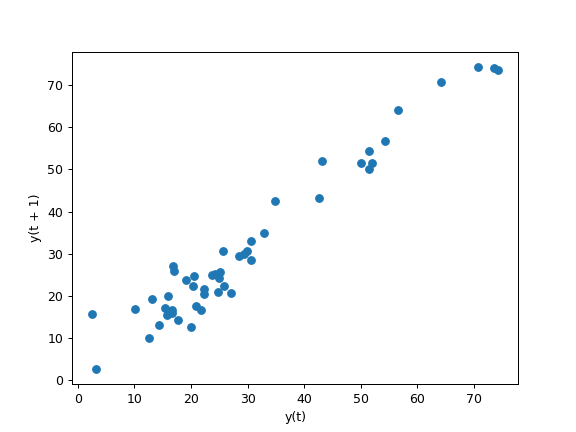
滞后图最常用于查找时间序列数据中的模式。
给定以下时间序列
>>> np.random.seed(5)
>>> x = np.cumsum(np.random.normal(loc=1, scale=5, size=50))
>>> s = pd.Series(x)
>>> s.plot()

滞后为
lag=1的滞后图返回>>> pd.plotting.lag_plot(s, lag=1) <Axes: xlabel='y(t)', ylabel='y(t + 1)'>