pandas.plotting.bootstrap_plot#
- pandas.plotting.bootstrap_plot(series, fig=None, size=50, samples=500, **kwds)[源代码]#
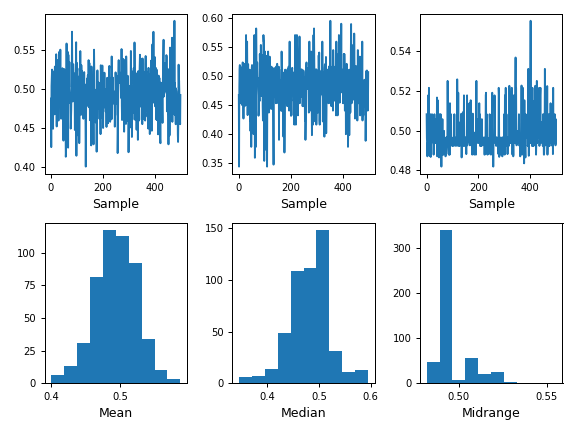
均值、中位数和中列值统计量的 Bootstrap 图。
Bootstrap 图用于通过依赖于有放回的随机抽样来估计统计量的方差 [1]。此函数将为给定大小的给定样本数生成均值、中位数和中列值统计量的 bootstrap 图。
[1]“Bootstrapping (statistics)” in https://en.wikipedia.org/wiki/Bootstrapping_%28statistics%29
- Parameters:
- seriespandas.Series
用于引导抽样的系列。
- figmatplotlib.figure.Figure, 默认为 None
如果给出,它将使用 fig 引用进行绘图,而不是使用默认参数创建新的图形。
- sizeint, 默认为 50
每次抽样要考虑的数据点数。它必须小于或等于 series 的长度。
- samplesint, 默认为 500
执行 Bootstrap 过程的次数。
- **kwds
传递给 matplotlib 绘图方法的选项。
- Returns:
- matplotlib.figure.Figure
Matplotlib 图。
参见
pandas.DataFrame.plotDataFrame 对象的绘图基础。
pandas.Series.plotSeries 对象的绘图基础。
Examples
此示例绘制了 Series 的基本 Bootstrap 图。
>>> s = pd.Series(np.random.uniform(size=100))
>>> pd.plotting.bootstrap_plot(s)
<Figure size 640x480 with 6 Axes>